Turn insights into action with AskField Analytics
AskField Analytics is a comprehensive survey analytics tool designed specifically for survey researchers. Transform raw survey data into actionable insights with descriptive statistics, cross-tabulation, segmentation analysis, and advanced visualization. Export to Excel, CSV, PDF, and SPSS formats for further analysis.
Sign up for a Trial
Here's your answer to analysis paralysis
Designed for
survey data
Unlike generic analytics platforms, AskField Analytics is purpose-built for survey research with specialized features for cross-tabulation, segmentation, and survey-specific statistical analysis.
Easy-to-use
Simple drag-and-drop functionality and built-in statistical analysis lets anyone be a data wizard.
Share data securely
The Key Findings portal enables you to securely share the most important survey results with colleagues and clients.
End-to-end data treatment
Collect data through AskField Online, CATI, Mobile, or Field Operations, then analyze, chart, and visualize all within the same integrated platform. Seamless data flow from collection to insights.
One-click visuals
Crosstabs can be turned into visual charts with one simple click. Integrate with text, images or video.
Affordably priced
Competitive and priced for research budgets of all sizes.
Bring your insights to life
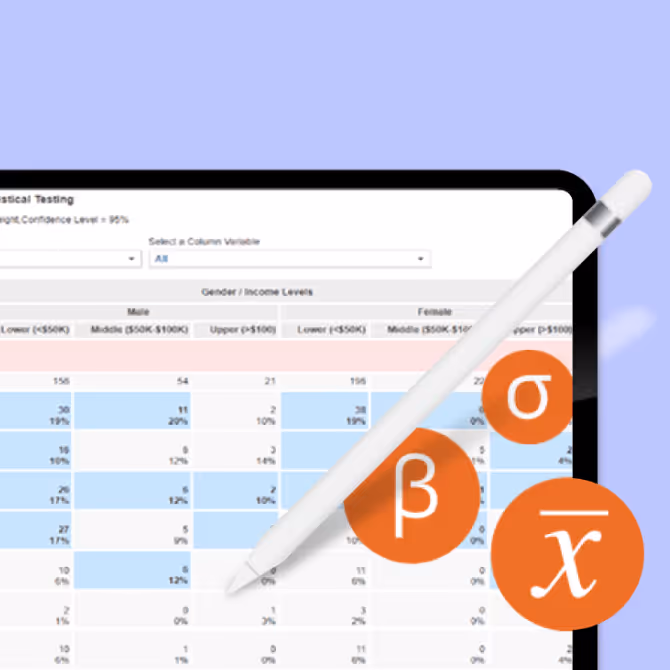
Data Management and Cross-Tabulation
Import data from multiple formats (SPSS, Excel, CSV, SAS) and create sophisticated cross-tabulations with drag-and-drop functionality. Support for two-way, three-way, and higher-dimensional tables with automatic calculation of cell counts, percentages, and statistical significance tests including chi-square tests and p-values.
Descriptive Statistics and Advanced Analytics
Comprehensive descriptive statistics including mean, median, mode, standard deviation, variance, and percentiles. Advanced statistical tests including Linear Regression, Ordered Logistic Regression, Factor Analysis, and support for Custom R Scripts. Statistical significance testing integrated throughout analysis.
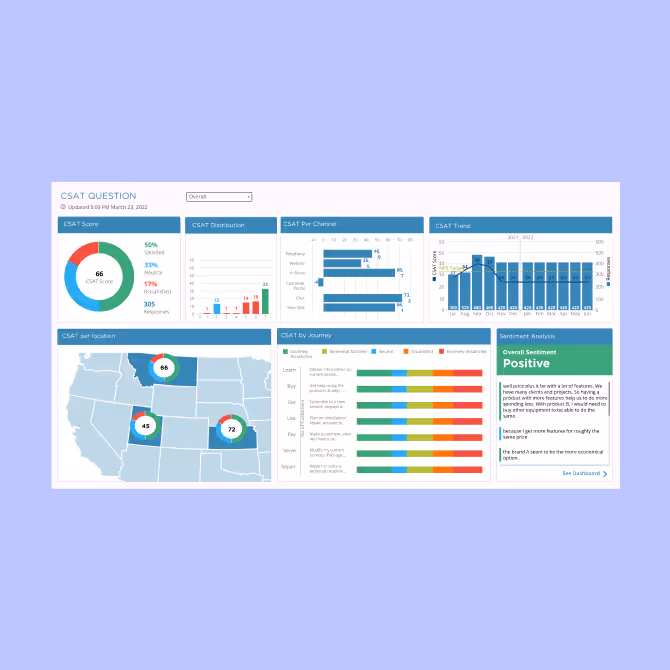
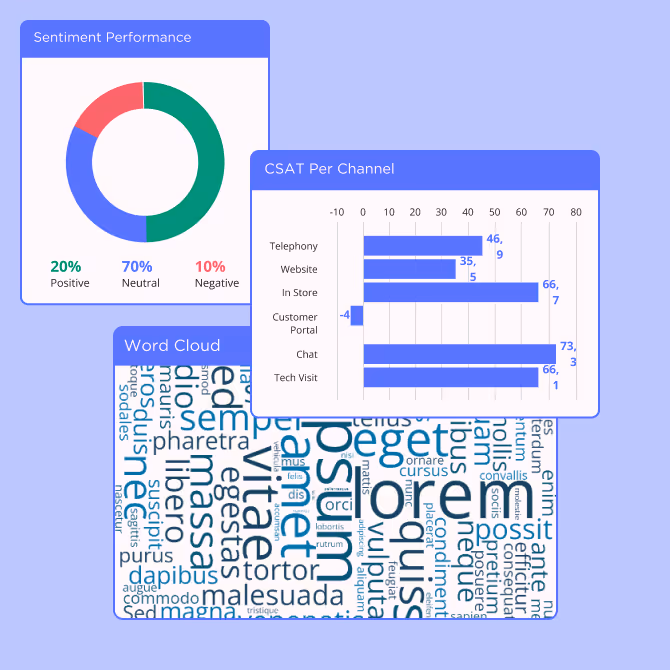
Rich Visualization and Charting
Wide range of chart types including bar charts, line charts, pie charts, donut charts, area charts, and word clouds. Interactive charts with drill-down capabilities, filtering, and zoom. Export charts to PNG, JPEG, SVG, and PDF formats. Publication-ready visualizations with customizable styling.
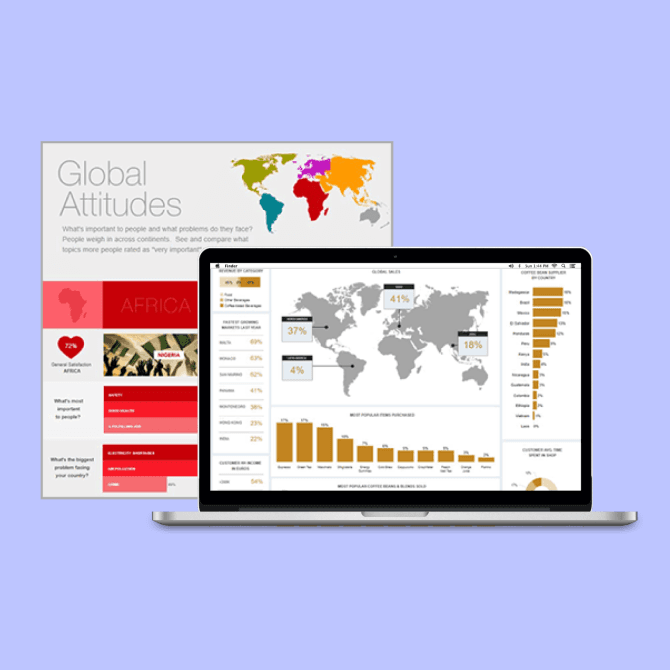
Segmentation and Data Storytelling
Advanced segmentation analysis to divide respondent populations into meaningful subgroups. Create custom segmentation rules with logical operators and conditional statements. Build visually appealing data stories with shareable report links, customizable dashboards, and role-based views for different stakeholders.
What our clients
say about us.

"We've been avid users of the AskField platform now for over 20 years. It gives us the flexibility to routinely enhance our survey toolkit and provides our clients with a more robust dataset and story to tell their clients."
Steve Male
VP Innovation & Strategic Partnerships

"AskField Multi-Mode has allowed us to synchronize our different data collection methods perfectly. Whether we're recruiting on the street, testing products in a controlled virtual environment, or getting feedback over the phone, AskField has made it easier to plan future projects."
Luc M.
CEO
Ready to Answer Anything?
AskField is how anyone with complex research questions gets better answers, faster. Speak with an AskField survey specialist today.
Sign up for a Trial